Overfitting Detection: The Specific Red Flags in Backtest Results
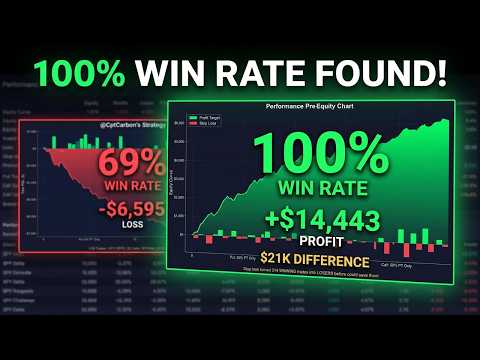
Overfitting is the single most common reason algorithmic trading strategies fail in live deployment. The challenge is that overfitted strategies look great in standard backtests — that's exactly the problem. Learning to recognize the specific red flags that suggest overfitting helps you avoid deploying strategies that are fitted to historical noise.
What Overfitting Actually Means
Overfitting occurs when a strategy's parameters are optimized to fit specific features of historical data that don't persist into the future. The strategy learns the specific sequence of past events rather than the underlying structure that would predict future events.
Imagine a strategy with 50 parameters tested on 10 years of data. The optimizer finds the parameter combination that produces the highest historical return. That combination may work great on this specific history but have no predictive value for the future.
The more parameters, the more opportunities for overfitting. The more combinations tested, the more likely some combination looks great by chance.
Red Flag 1: Suspiciously High Backtest Returns
Specific red flag: backtest showing 50%+ annualized returns or 3.0+ Sharpe ratio for a strategy that trades liquid instruments.
Why it's suspicious: sustainable 50% returns in liquid markets would attract massive capital, arbitraging away the edge. Strategies that genuinely achieve this level either have specific institutional advantages (prop trading desks, HFT infrastructure) or capacity limits (small size only).
Realistic ranges: retail strategies on liquid instruments showing 10-25% annualized returns in walk-forward testing are plausible. 30%+ is suspicious. 50%+ is almost certainly overfitted or has unmeasured risks.
Red Flag 2: Excellent Performance in Every Market Condition
Specific red flag: strategy performs similarly well in bull markets, bear markets, high volatility, low volatility, trending, and range-bound conditions.
Why it's suspicious: real strategies tend to have specific environmental sensitivities. A strategy that works in all environments either genuinely has broad edge (rare) or has been overfitted to look that way (common).
Testing approach: split backtest by market regime (VIX regimes, bull/bear markets, specific years). Honest strategies show substantial variation across regimes. Strategies that look uniform across regimes are suspicious.
Red Flag 3: Parameter Values Very Specific
Specific red flag: optimal strategy parameters are highly specific (RSI period of 23 instead of 20, moving average of 157 instead of 150).
Why it's suspicious: real market edges tend to be robust to small parameter changes. Specific parameter values suggest fitting to noise rather than capturing underlying structure.
Testing approach: vary each parameter by 10-20%. Robust strategies maintain reasonable performance. Overfitted strategies show dramatic performance degradation with small parameter changes.
Red Flag 4: Narrow Winning Period Clusters
Specific red flag: strategy's returns come primarily from specific narrow periods rather than consistently distributed.
Why it's suspicious: overfitted strategies often rely on specific historical events. The parameters that look optimal are the ones that happened to catch those events.
Testing approach: examine the distribution of returns across the backtest period. Strategies with 80% of gains in 20% of time are suspicious. Strategies with returns relatively distributed across time are more trustworthy.
Red Flag 5: Walk-Forward Performance Dramatically Worse
Specific red flag: standard backtest Sharpe of 2.5 but walk-forward Sharpe of 0.8.
Why it's suspicious: this gap is the direct measurement of overfitting. The standard backtest allowed parameter optimization on all data; the walk-forward tests parameters on data they weren't optimized on. The gap reflects fitting to noise.
Testing approach: always run walk-forward optimization. Trust the walk-forward Sharpe more than the standard backtest Sharpe. If walk-forward Sharpe is below 0.5, the strategy likely has no genuine edge.
Red Flag 6: Many Parameters Relative to Data
Specific red flag: strategy has 30 parameters but only 500 trades over the backtest.
Why it's suspicious: rule of thumb from statistical learning: you need many more observations than parameters to avoid overfitting. 30 parameters requires thousands of observations for reliable fitting.
Rule of thumb: aim for 50+ trades per parameter. For 30-parameter strategies, backtest should include 1,500+ trades. If you can't achieve this, reduce parameters or expand data.
Red Flag 7: Perfect Timing on Specific Events
Specific red flag: strategy perfectly caught every major market move in the backtest (every crash shorted, every rally longed).
Why it's suspicious: real strategies miss some events. Strategies that catch every event are typically fitted to the specific sequence rather than genuinely predicting future events.
Testing approach: examine specific major market events. Did the strategy catch them with ex-ante available information, or does the catch require hindsight?
Red Flag 8: Return Distribution Too Narrow
Specific red flag: strategy returns are extremely consistent with minimal downside.
Why it's suspicious: financial returns are typically fat-tailed. Strategies showing normal distributions or extremely narrow distributions are often hiding tail risks that will emerge in live trading.
Testing approach: Monte Carlo simulation with resampled returns. If simulated distributions show substantially wider ranges than the original backtest, the backtest may be masking variability.
Red Flag 9: Strategy Works Only on Specific Instruments
Specific red flag: strategy works great on specific stock X, less well on similar stock Y, and poorly on broader portfolio.
Why it's suspicious: strategies with genuine edge based on behavioral or structural features should work on multiple similar instruments. Strategies that work only on specific instruments may be fitted to the specific historical quirks of those instruments.
Testing approach: apply strategy to multiple similar instruments (SPY plus IWM plus QQQ plus VTI). Honest strategies show reasonable performance across the group. Strategies that only work on one instrument are suspicious.
Red Flag 10: Discovered Through Many Tests
Specific red flag: strategy identified by testing 100+ variations and picking the best.
Why it's suspicious: out of 100 random strategies, several will look great by chance. Picking the best from many tested strategies effectively selects for luck more than skill.
Testing approach: out-of-sample validation on data not used during strategy development. If the strategy was found through testing many variations on in-sample data, the out-of-sample test is the critical validation.
The Specific Protection Framework
To avoid overfitting:
Limit parameter count. 3-10 parameters typical for robust strategies. 20+ requires substantial evidence of genuine edge.
Walk-forward optimize. Standard backtests allow substantial overfitting. Walk-forward testing catches more.
Out-of-sample validation. Reserve 20-30% of data not touched during development. Final strategy validation on this data.
Multiple instrument testing. Verify strategy works across similar instruments, not just the one it was developed on.
Parameter stability testing. Verify small parameter changes don't dramatically affect performance.
Realistic expectations. Treat suspiciously high backtest returns with skepticism. Live performance will be lower.
Honest comparison. Benchmark against buy-and-hold or simple alternatives. Many "edge" strategies barely beat simple approaches when properly tested.
The Practical Takeaway
Overfitting detection is more art than science. The red flags above are suggestive but not definitive. A strategy with multiple red flags is likely overfitted. A strategy with none is still potentially overfitted — but less likely.
The specific habit to develop: treat your own backtests with the same skepticism you would apply to a stranger's. If the backtest results seem too good to be true, they probably are.
The traders who deploy strategies with realistic expectations about live performance typically have better long-term outcomes than those who deploy strategies based on optimistic backtest results. The specific adjustment: expect live performance 40-60% lower than backtest, with 1.5-2x higher drawdown.
Overfitting is the enemy of profitable algorithmic trading. Learning to detect it in your own research is one of the most valuable skills a strategy developer can build.